

As paid search marketers, we have something of a love affair with data. Paid search marketing is expensive, so we want to know where every cent is going and whether or not our ad spend is producing sales. Or at least, that’s what we tell ourselves.Over the last three years, we’ve audited more than 2,000 AdWords accounts at Disruptive Advertising. We’ve analyzed hundreds of millions of dollars of ad spend, nearly 100 billion impressions and well over 500 million clicks.
After documenting, reviewing, and assessing all of those AdWords accounts in detail, we were forced to face a sad truth: paid search marketers aren’t as data-obsessed as we say we are.
However, for those paid search marketers that are data-obsessed, our audits uncovered an exciting way to use your data to dramatically and predictably improve your account performance.
Here’s what we dischttps://www.searchenginejournal.com/use-ppc-account-audits-new-clients-improved-performance/134968/overed.
Conversion Tracking
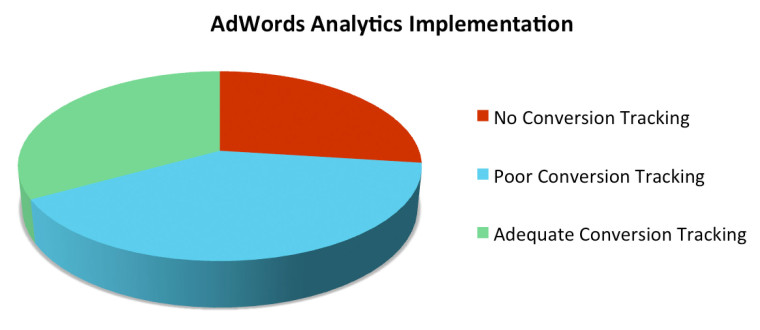
Perhaps the most obvious finding of our 2,000+ audits was the fact that very few AdWords accounts have effective conversion tracking in place.
Now, that’s not to say that most accounts aren’t tracking conversions. In fact, 58% of the accounts in our study had tracked at least one conversion.
Only 29% of AdWords accounts are effectively tracking conversions.
However, only half of the accounts are actually tracking most-or-all of their actual conversions. That means only 29% of AdWords accounts are effectively tracking conversions.
The other 71% of AdWords accounts either had no conversion tracking in place or such poor conversion tracking that they had no idea whether or not their campaigns were working.
The problem is, if you aren’t tracking all your conversions, you don’t know which campaigns are actually producing results.
Take the plumbing/HVAC industry for example. Generally speaking, most plumbing leads come in the form of phone calls, not form submissions.
Your typical plumbing/HVAC company, however, is only tracking form submissions. As a result, they don’t know which paid search campaigns are driving the majority of their conversions.
Technically, they have conversion tracking in place, but it’s not doing them any good.
We run into this problem all of the time during our account audit process. Often, companies say they have conversion tracking in place, but when we start asking about what actually constitutes a conversion for their company, it quickly becomes clear that they aren’t tracking what really matters.
What is a “Good” Conversion Rate?
Not surprisingly, since only half of the AdWords accounts that are tracking conversions are doing so effectively, most conversion rate estimates are skewed towards 0%.
The problem is, when most people estimate the “typical” conversion rate, they assume that if an AdWords account is tracking any conversions, it must be tracking most or all conversions.
For example, here are the results of an analysis Wordstream ran on hundreds of AdWords accounts to create conversion rate benchmarks for AdWords campaigns.
- The median conversion rate was 2.35%.
- The bottom 25% of accounts had a conversion rate of 0-1%.
- The top 25% of accounts had conversion rates of 5.31% or better.
It was an interesting study, but a flawed one.
To their credit, Wordstream tried to account for poor conversion tracking by excluding accounts with less than 10 conversions, but without directly auditing the accounts they were pulling data on, they didn’t know if the accounts in their sample were tracking actually conversions effectively.
Here’s what we found when we duplicated Wordstream’s analysis using our data. Not surprisingly, the results were very similar to Wordstream’s findings.
- The median conversion rate was 2.18%.
- 27.5% of accounts had a conversion rate of 0-1%.
- The top 25% of accounts had a conversion rate of 5.34% or better.
Here’s how the data looks when you break it down into conversion rate ranges:
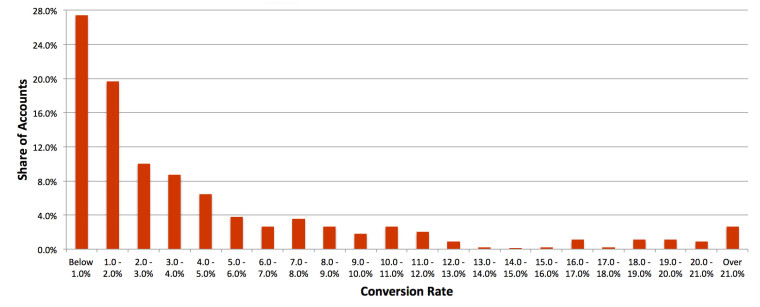
It’s not immediately obvious from this chart, but a conversion rate of over 11.03% means your AdWords account is outperforming 90% of AdWords accounts (in Wordstream’s study, the top 10% of accounts converted 11.45% or more of their traffic).
The only problem is, this analysis included a huge number of accounts that we knew from our audit process were not tracking their conversions effectively.
These accounts meet Wordstream’s criteria, but their data was skewing our results.
The top 10% of well-tracked AdWords accounts have a conversion rate of over 20%.
Here’s how the data changed when we only included the few hundred accounts with good conversion tracking in place:
- The median conversion rate for a well-tracked AdWords account is 3.16%.
- Only 15.2% of AdWords accounts have a conversion rate of 0-1%.
- The top 25% of accounts have a conversion rate of 7.82% or better.
Again, here’s the data looks if you break it down into conversion ranges:
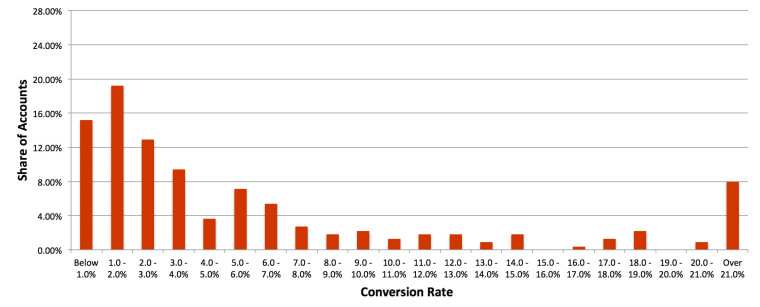
Clearly, if you don’t have solid tracking in place, you’re probably missing out on a huge percentage of your conversions!
And here’s the thing, if you don’t know if your campaigns are converting effectively, you’re probably wasting most of your AdWords budget.
Ad Spend Efficiency
It’s clear that most AdWords accounts aren’t doing a good job of tracking conversions. The question is, how does that affect campaign performance?
To get at that data, we need to look at where your AdWords budget is really going.
Since AdWords is pay-per-click marketing, it doesn’t make a ton of sense to bid on keywords or search terms that don’t produce conversions. After all, if you are paying for traffic that doesn’t convert, you are probably paying for the wrong traffic.
Ideally, you should be spending the majority of your budget on search terms with a track record of producing conversions. These search terms are how your target audience is actually finding you.
The problem is, most companies spend the majority of their AdWords budgets on search terms that have never produced a single conversion. These search terms are typed in by the wrong sort of traffic and—as a result—they never convert.
Paying for these search terms is a waste of money. The question is, what percentage of ad spend is being wasted on the wrong search terms?
Wasted Ad Spend
Now, you can only accurately assess ad spend efficiency from accounts that have quality tracking in place, so these results come from the 29% of our audited accounts that were tracking conversions effectively.
61% of ad spend is wasted.
In total, these accounts spent 61% of their budgets on search terms that never converted.
In other words, 61% of ad spend is wasted.
However, as you can see below, the more you spend on AdWords, the less you usually waste on the wrong search terms.
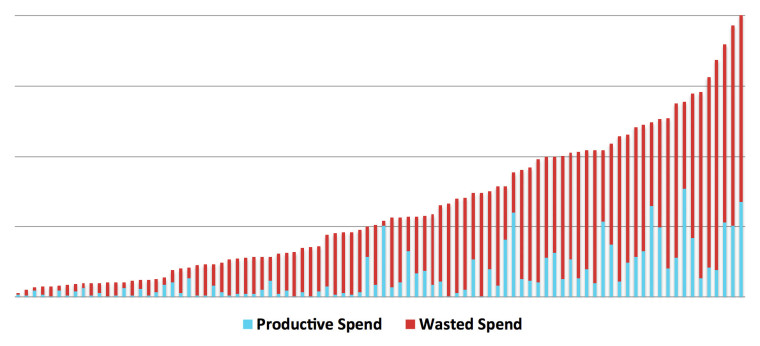
Note, a chart with our entire database of accounts is almost impossible to read on this blog, so this image shows only a few dozen accounts. However, the depicted trend is consistent across hundreds of accounts.
The average AdWords account wastes 76% of its budget on the wrong search terms.
On a per account basis, wasted ad spend accounts for 6.6-99.7% of total ad spend. The median AdWords account wastes 76% of its budget on the wrong search terms.
And, without good conversion tracking in place, there’s not much you can do about it.
However, if you are tracking your conversions effectively, you can use this data to profoundly impact the performance of your AdWords campaigns.
How Does Wasted Ad Spend Affect Your Account?
At first glance, you might think that wasted ad spend and cost-per-conversion would have a linear relationship—every 10% increase in wasted ad spend would increase your cost-per-conversion by 10%.
Annoying, but not too bad, right?
Unfortunately, that’s not the case. As it turns out, wasted ad spend and cost-per-conversion have an exponential relationship.
Since cost-per-click has a significant effect on cost-per-conversion, let’s look at how wasted ad spend varies with cost-per-conversion for AdWords accounts with a cost-per-click of around $1.00.

Basically, for every 10% increase in wasted ad spend your cost-per-conversion increases by 44-72%.
Every time.
For example, say you’re currently wasting 30% of your budget on non-converting search terms and your cost-per-conversion is $10.00. If you start bidding on a bunch of new keywords and your wasted ad spends increases to 40%, your new cost-per-conversion will be approximately $14.40 to $17.20.
Every 10% increase in wasted ad spend increases your cost-per-conversion by 44-72%.
If your wasted ad spend increases from 30% to say, 76%, your cost-per-conversion be around $53.79-120.20.
That’s a 540-1,200% increase!
And, this trend holds true for every industry, conversion rate, and average cost-per-click.
The fact of the matter is, the more money you waste on non-converting search terms, the less money you can put towards the search terms that matter.
Now, as exciting as this observation is, it’s important to note that this model only explains about 60% of the variation in the data (for the statisticians out there, R2 = 0.597 after log-level regression). However, it is an accurate model of the data (ρ < 0.001).
As a result, the exact rate at which increases in wasted ad spend affects your cost-per-conversion will vary from account to account while still following the trends outlined in this article.
That being said, controlling your wasted ad spend is one of the best, most predictable ways to control your cost-per-conversion.
For comparison, let’s take a look at the quality score, which has been frequently described as the most effective way to manage cost-per-conversion.
Using the AdWords accounts with a $1.00 cost-per-click from our previous example, here’s how cost-per-conversion varies with impression-weighted quality score.
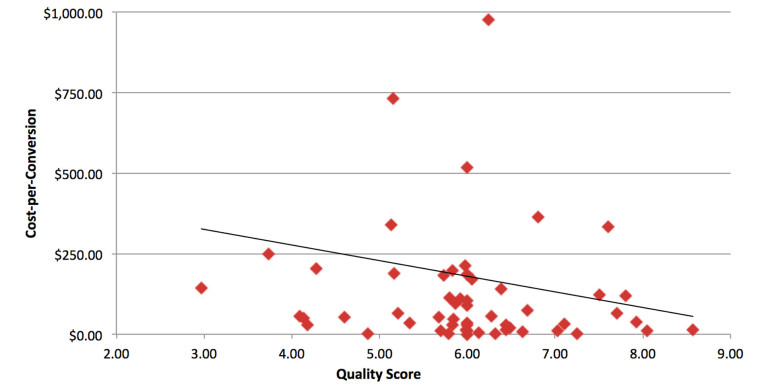
Looking at this chart, it seems like a pretty direct correlation—as quality score increases, cost-per-conversion decreases.
In fact, our results are strikingly similar to those reported by Larry Kim. If your quality score increases by 1 point, your cost-per-conversion decreases by 13% (Larry puts it at 16%). If your quality score decreases by 1 point, your cost-per-conversion increases by 13%.
Or does it?
Although a quality score-based model looks nice on paper, it only explains 1.2% of the variability in the data (R2 = 0.012).
In other words, there’s only a 1.2% chance that improving your quality score will improve your cost-per-conversion by 13%. The rest of the time, you have no idea how changing your quality score will affect your cost-per-conversion.
If you think about it, this makes complete sense. If 76% of your ad spend is being wasted on the wrong search terms, tweaking your ad copy or landing pages to bump up your quality score a few points isn’t going to make much of a difference to your cost-per-conversion.
Other the other hand, if most of your ad spend is going towards the right search terms, a higher quality score will reduce your cost-per-click and, therefore, your cost-per-conversion.
Using This Data
Fortunately, understanding how wasted ad spends affects the performance of your AdWords account gives you a huge leg up on the competition.
Once we discovered how wasted ad spend affects AdWords campaign performance, we made reducing wasted ad spend a key part of how we manage our clients’ AdWords accounts.
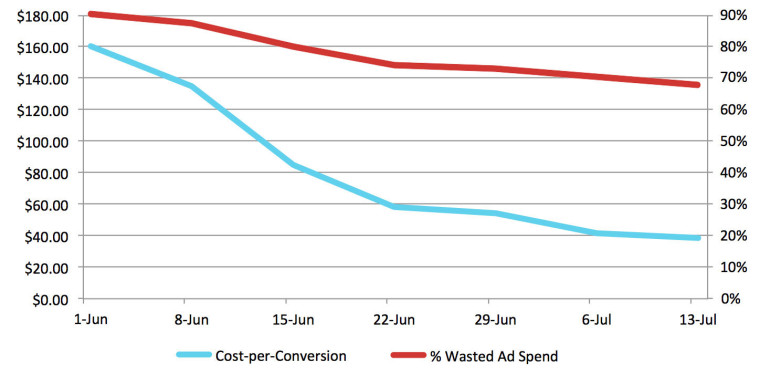
The results are remarkable. Here’s what happens:
On the left, you can see how much is being spent on each term compared with the number of conversions that the search term is producing. The bar graph to the right shows how those changes affect total ad spend and conversions.
As you can see, shifting your ad spend away from your non-converting search terms reduces your overall spend and increases your total conversions.
In other words, that exponential relationship between wasted ad spends and cost-per-conversion works in reverse, too!
For example, as we reduced one client’s wasted ad spend from 91% to 68%, their cost-per-conversion dropped from $160.38 to $38.58…in a matter of weeks.
Since this approach focuses your budget on what’s working, the benefits of reducing wasted ad spend pass all the way through to your cost-per-sale. For example, with this technique, we regularly see results like 300-500% more sales or 25-65% lower costs-per-sale.
So, if you’re looking for a reliable, effective way to reduce cost-per-conversion and cost-per-sale, pull your Search Terms report and start eliminating your wasted ad spend!
Summary
After auditing more than 2,000 AdWords accounts, it’s become clear that many search engine marketers aren’t using AdWords to its full potential.
Even if your account doesn’t fall into the 71% of poorly tracked AdWords accounts, you’re probably still wasting 76% of your budget on the wrong search terms. It’s time to stop!
To succeed in today’s competitive paid search market, we have to do more than just talk about data. We need to track everything and then use that data to focus our efforts on minimizing marketing waste and maximizing conversions and profits.
Fortunately, even a few simple changes can dramatically improve the performance of your AdWords account. It takes some extra effort, but the results are worth it.
You’ve heard my two cents, now it’s your turn.
Do these findings make sense to you? Did any of these findings surprise you? How do you use your data to improve your account performance?
Image Credits
Featured Image: Tatiana Popova/Shutterstock.com


